Watch the progress of your Business
Easy to reference
The reporting module does not seek to replace much more advanced tools used for data analysis. However, it offers a first simple and clear summary of your business trends.
Differentiated data
If you work in teams and each representative has limited access to a number of customers, the data displayed will only relate to the documents of customers associated with their user account. A simple tool in the hands of the rep to measure their performance.
Customer Report
By activating the Customer Visit Mode you can browse the entire Report module, viewing only the data related to the customer in question. A quick way to understand what type of product they prefer, how many have been ordered and when.
Different types of Reports
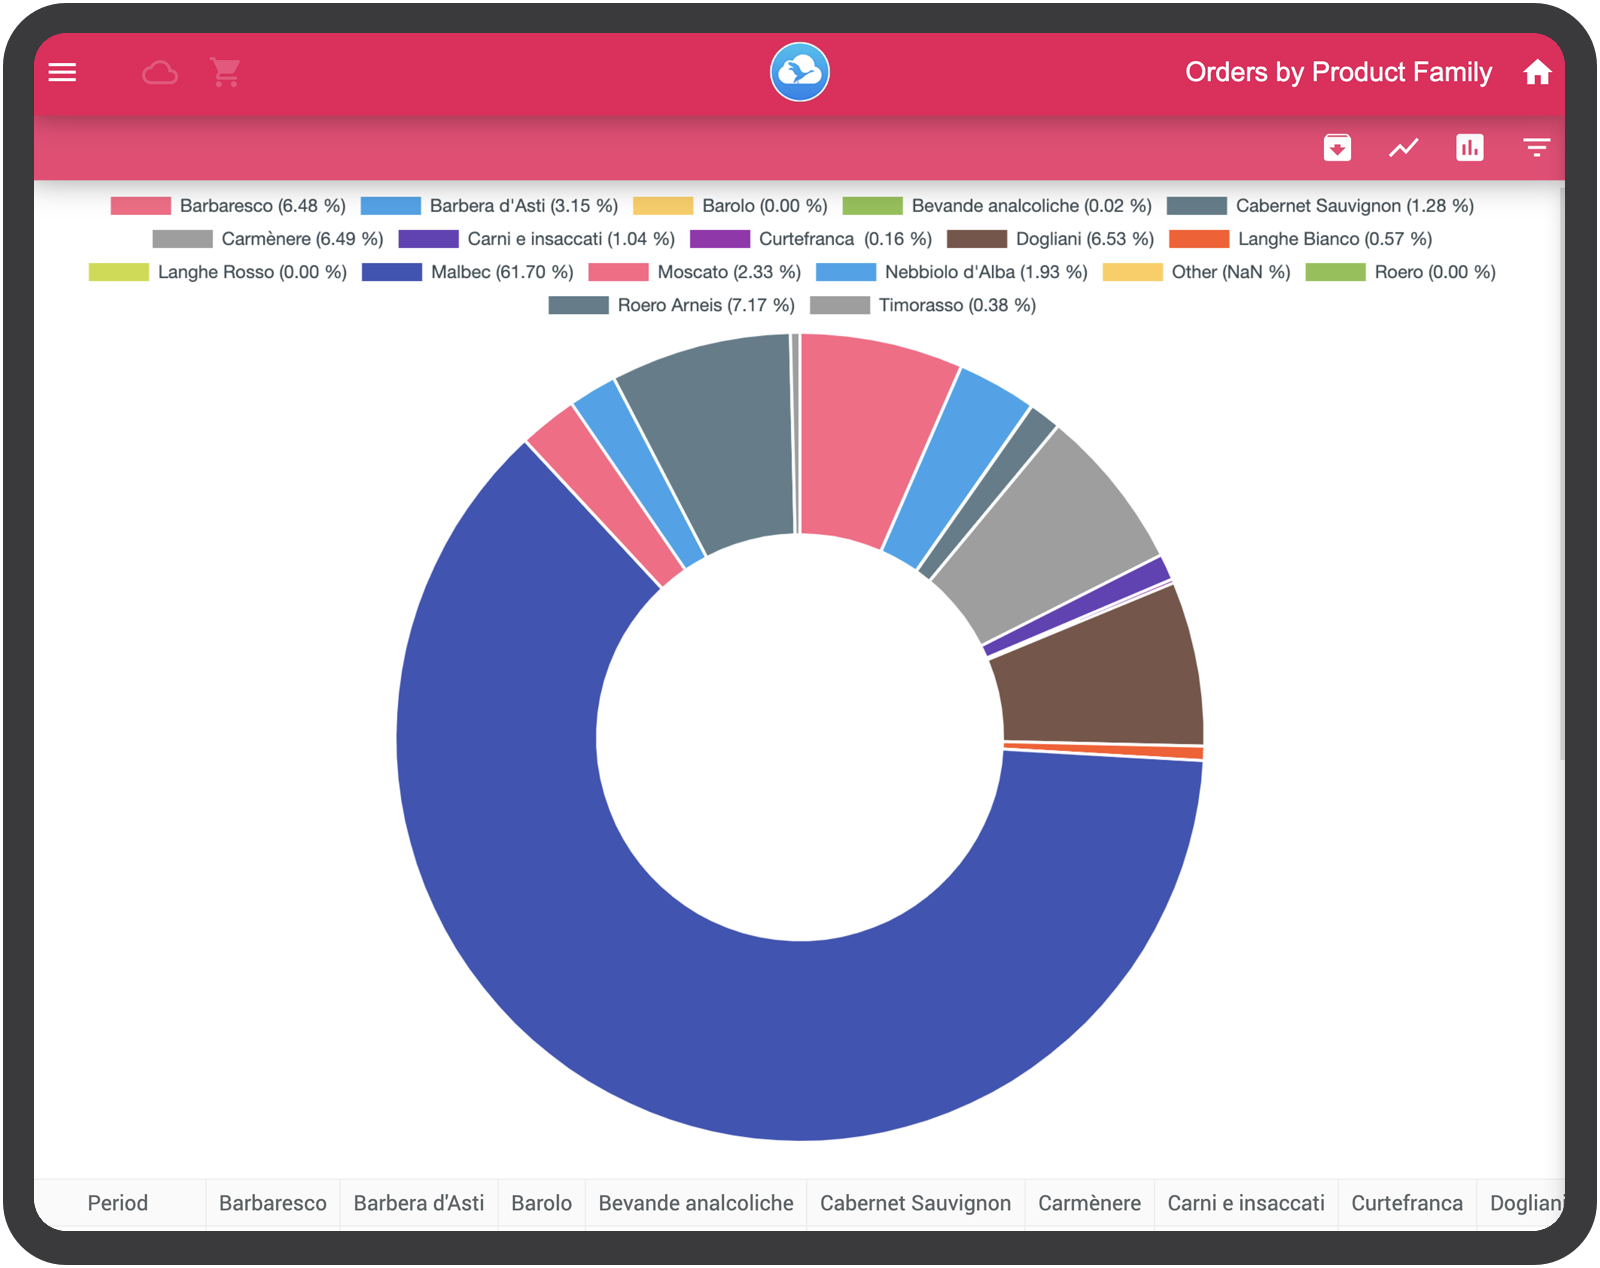
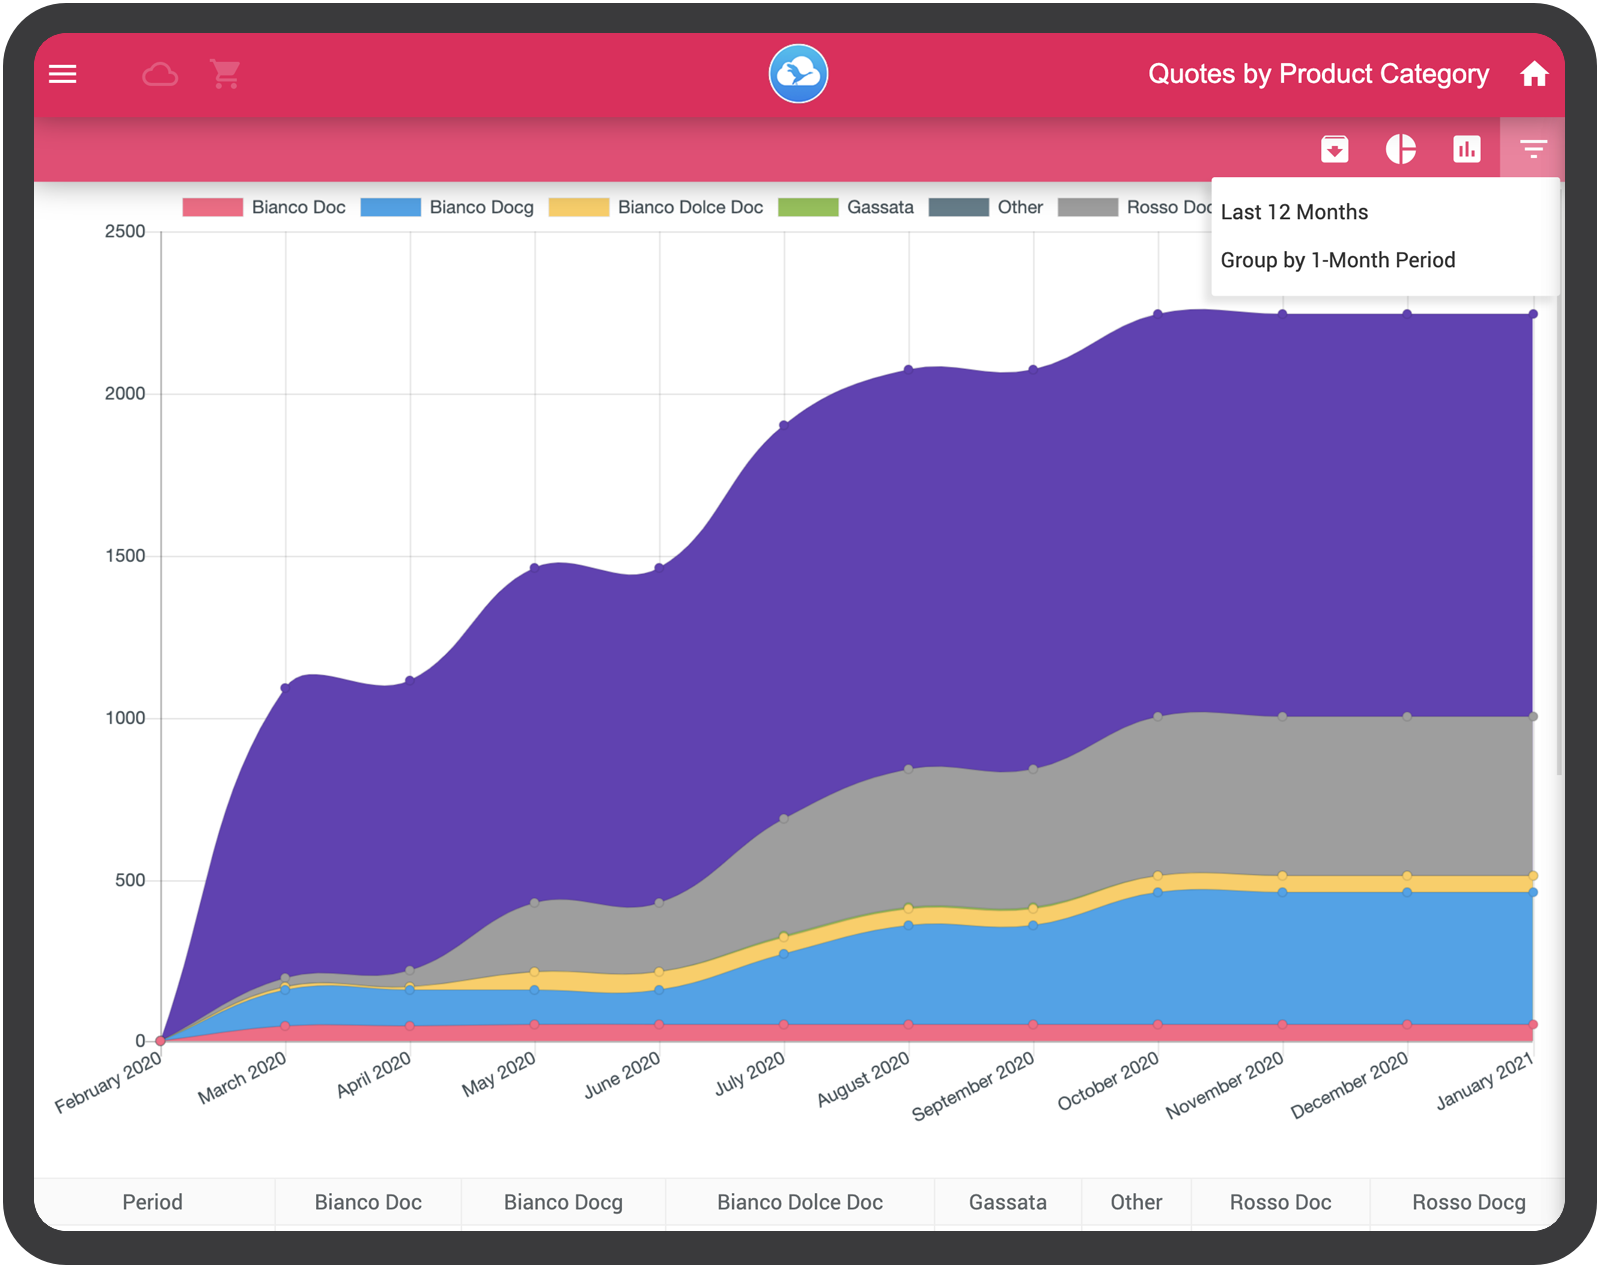
View the performance of your turnover via a bar graph. Monitor the performance of quotes by easily identifying the provisional ones and those confirmed. Make use of pie charts for types.


Filter by Category and Type of Document
Filter by document type (Quotes, Orders or Invoices) or change the time scale from 3 months to 3 years.
Apply filters to cross the data with the type of product, the family or product classifications.